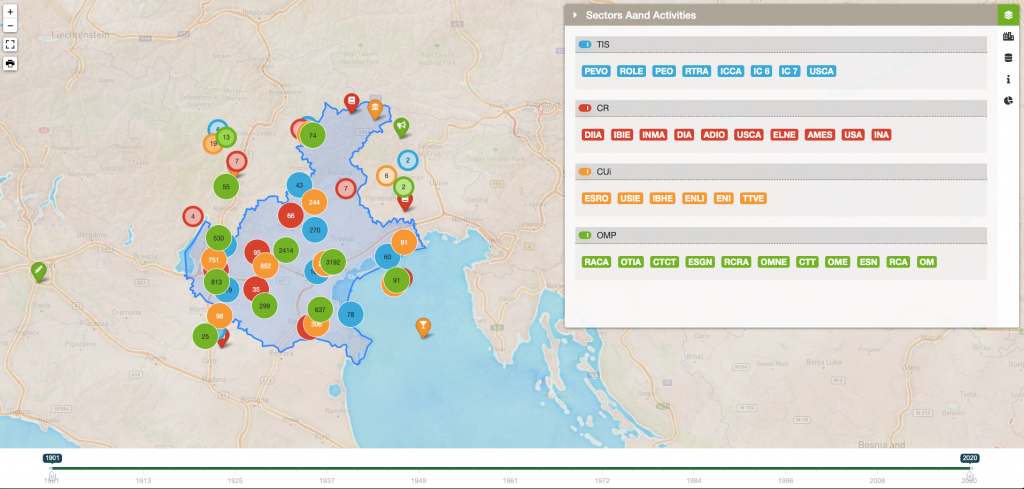
An experiment in enabling application level data filtering and reactive update of multiple widgets including a Leaflet Map and a amCharts graph.
- Load data from Google Sheets (15k+ records)
- Display as multiple clustered layers on the map, single markers have dynamically assigned font-awesome icons
- Filter by data facets
- Filter by time interval
- Display TreeMap data structure analysis